SciChart WPF 3D Charts > Axis3D APIs > Axis Types in SciChart3D
Axis Types in SciChart3D

SciChart 3D WPF features several axis types. All inherit from AxisBase3D. The Axis are declared in XAML or in code, and are the logical representation of the XZ, ZY, YX planes in the Axis Cube.

Axes are required to measure the SciChart3DSurface.RenderableSeries, for instance, an axis is responsible for the transformation between data-values (provided by your code) and world coordinates (X,Y,Z values in 3D Space).

NOTE: It is necessary to declare SciChart3DSurface.XAxisSciChart3DSurface.YAxis and SciChart3DSurface.ZAxis in XAML or in code before the 3D chart will draw.

Axis types available in SciChart3D are listed below.

NumericAxis3D

The NumericAxis3D is a Value-Axis and is suitable when the data on that axis is numeric (e.g. double, it, long, float, short). It is not suitable for when the data-type is DateTime or TimeSpan.

Declare a NumericAxis3D as follows.

<!-- Where xmlns:s3D="http://schemas.abtsoftware.co.uk/scichart3D" -->
<s3D:SciChart3DSurface>
       <!-- ... omitted for brevity -->
       <!-- Create a NumericAxis3D on the YAxis -->
       <s3D:SciChart3DSurface.YAxis>
             <s3D:NumericAxis3D AxisTitle="Number of Samples (per Series)"
                            TextFormatting="n2"
                            AutoRange="Once"
                            VisibleRange="0,10"
                            GrowBy="0.1, 0.1"
                            TickLabelAlignment="Camera"/>
       </s3D:SciChart3DSurface.YAxis>
       <!-- ... omitted for brevity -->
</s3D:SciChart3DSurface>
var sciChart3DSurface = new SciChart3DSurface();
var yAxis = new NumericAxis3D()
{
       TextFormatting = "n2",
       AutoRange = AutoRange.Once,
       VisibleRange = new DoubleRange(0, 10),
       GrowBy = new DoubleRange(0.1, 0.1),
       TickLabelAlignment = TextAlignment3D.Camera,
       AxisTitle = "Y-Value"
};
sciChart3DSurface.YAxis = yAxis;


DateTimeAxis3D

The DateTimeAxis3D is a Value-Axis and is suitable when the data on that axis is a DateTime.

Declare a DateTimeAxis3D as follows.

<!-- Where xmlns:s3D="http://schemas.abtsoftware.co.uk/scichart3D" -->
<s3D:SciChart3DSurface>
       <!-- ... omitted for brevity -->
       <!-- Create a NumericAxis3D on the YAxis -->
       <s3D:SciChart3DSurface.YAxis>
             <s3D:DateTimeAxis3D AxisTitle="Time"
                            TextFormatting = "dd-MMM-yyyy"
                            SubDayTextFormatting = "HH:mm:ss"
                            AutoRange="Once"
                            GrowBy="0.1, 0.1"
                            TickLabelAlignment="Camera"/>
       </s3D:SciChart3DSurface.YAxis>
       <!-- ... omitted for brevity -->
</s3D:SciChart3DSurface>
var sciChart3DSurface = new SciChart3DSurface();
var yAxis = new DateTimeAxis3D()
{
       TextFormatting = "dd-MMM-yyyy",
       SubDayTextFormatting = "HH:mm:ss",
       AutoRange = AutoRange.Once,
       VisibleRange = new DateRange(DateTime.Today, DateTime.Today.AddDays(10)),
       GrowBy = new DoubleRange(0.1, 0.1),
       TickLabelAlignment = TextAlignment3D.Camera,
       AxisTitle = "Y-Value"
};
sciChart3DSurface.YAxis = yAxis;


TimeSpanAxis3D

The TimeSpanAxis3D is a Value-Axis and is suitable when the data on that axis is a TimeSpan.

Declare a TimeSpanAxis3D as follows.

<!-- Where xmlns:s3D="http://schemas.abtsoftware.co.uk/scichart3D" -->
<s3D:SciChart3DSurface>
       <!-- ... omitted for brevity -->
       <!-- Create a NumericAxis3D on the YAxis -->
       <s3D:SciChart3DSurface.YAxis>
             <s3D:TimeSpanAxis3D AxisTitle="Time"
                            TextFormatting = "dd-MMM-yyyy"
                            AutoRange="Once"
                            GrowBy="0.1, 0.1"
                            TickLabelAlignment="Camera"/>
       </s3D:SciChart3DSurface.YAxis>
       <!-- ... omitted for brevity -->
</s3D:SciChart3DSurface>
var sciChart3DSurface = new SciChart3DSurface();
var yAxis = new TimeSpanAxis3D()
{
       TextFormatting = "HH:mm:ss",
       AutoRange = AutoRange.Once,
       VisibleRange = new TimeSpanRange(TimeSpan.Zero, TimeSpan.FromMilliseconds(2000)),
       GrowBy = new DoubleRange(0.1, 0.1),
       TickLabelAlignment = TextAlignment3D.Camera,
       AxisTitle = "Y-Value"
};

sciChart3DSurface.YAxis = yAxis;


LogarithmicNumericAxis3D

The LogarithmicNumericAxis3D is a Logarithmic Value-Axis and is suitable when the data on that axis is a Numeric value e.g. Double, Int, Long, Float.

Declare a LogarithmicNumericAxis3D as follows.

<!-- Declare a Logarithmic YAxis in XAML -->
 <s3D:SciChart3DSurface>
    <s3D:SciChart3DSurface.XAxis>
        <s3D:NumericAxis3D/>
    </s3D:SciChart3DSurface.XAxis>
    <s3D:SciChart3DSurface.YAxis>
        <s3D:LogarithmicNumericAxis3D LogarithmicBase="10"
                                        FontSize="16"
                                        AxisTitle="Logarithmic YAxis"
                                        VisibleRange="0.1, 10000"
                                        TextFormatting="#.#E+0"
                                        ScientificNotation="LogarithmicBase"/>
    </s3D:SciChart3DSurface.YAxis>
    <s3D:SciChart3DSurface.ZAxis>
        <s3D:NumericAxis3D/>
    </s3D:SciChart3DSurface.ZAxis>        
</s3D:SciChart3DSurface>
// Declare a Logarithmic YAxis in Code
var scs = new SciChart3DSurface();
 
scs.XAxis = new NumericAxis3D();
scs.ZAxis = new NumericAxis3D();
scs.YAxis = new LogarithmicNumericAxis3D()
{
    LogarithmicBase = 10,
    ScientificNotation = ScientificNotation.LogarithmicBase,
    VisibleRange = new DoubleRange(0.1, 10000),
    TextFormatting = "#.#E+0",
};


Which results in this:

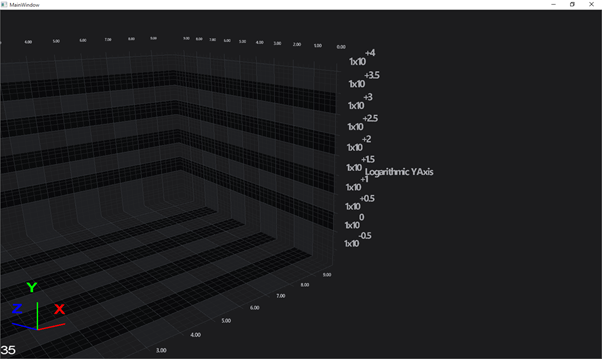
Logarithmic YAxis in SciChart 3D. Declared with ScientificNotation=LogarithmicBase, and base 10.